// Dashboards
Freight KPI Freight Forwarding Ops Dashboard
Operations dashboard for a Miami freight forwarding company. Tracks every package across the Doral and Medley warehouses: processed, shipped and delivered counts, end-of-day totals, and automated daily reports.
- Status
- In production
- Build time
- Build time: Under 3 weeks
The problem
A Miami freight forwarding company running two warehouses in Doral and Medley had no reporting system of any kind. Nobody could say how many packages were processed, shipped or delivered on a given day without walking the floor.
The build
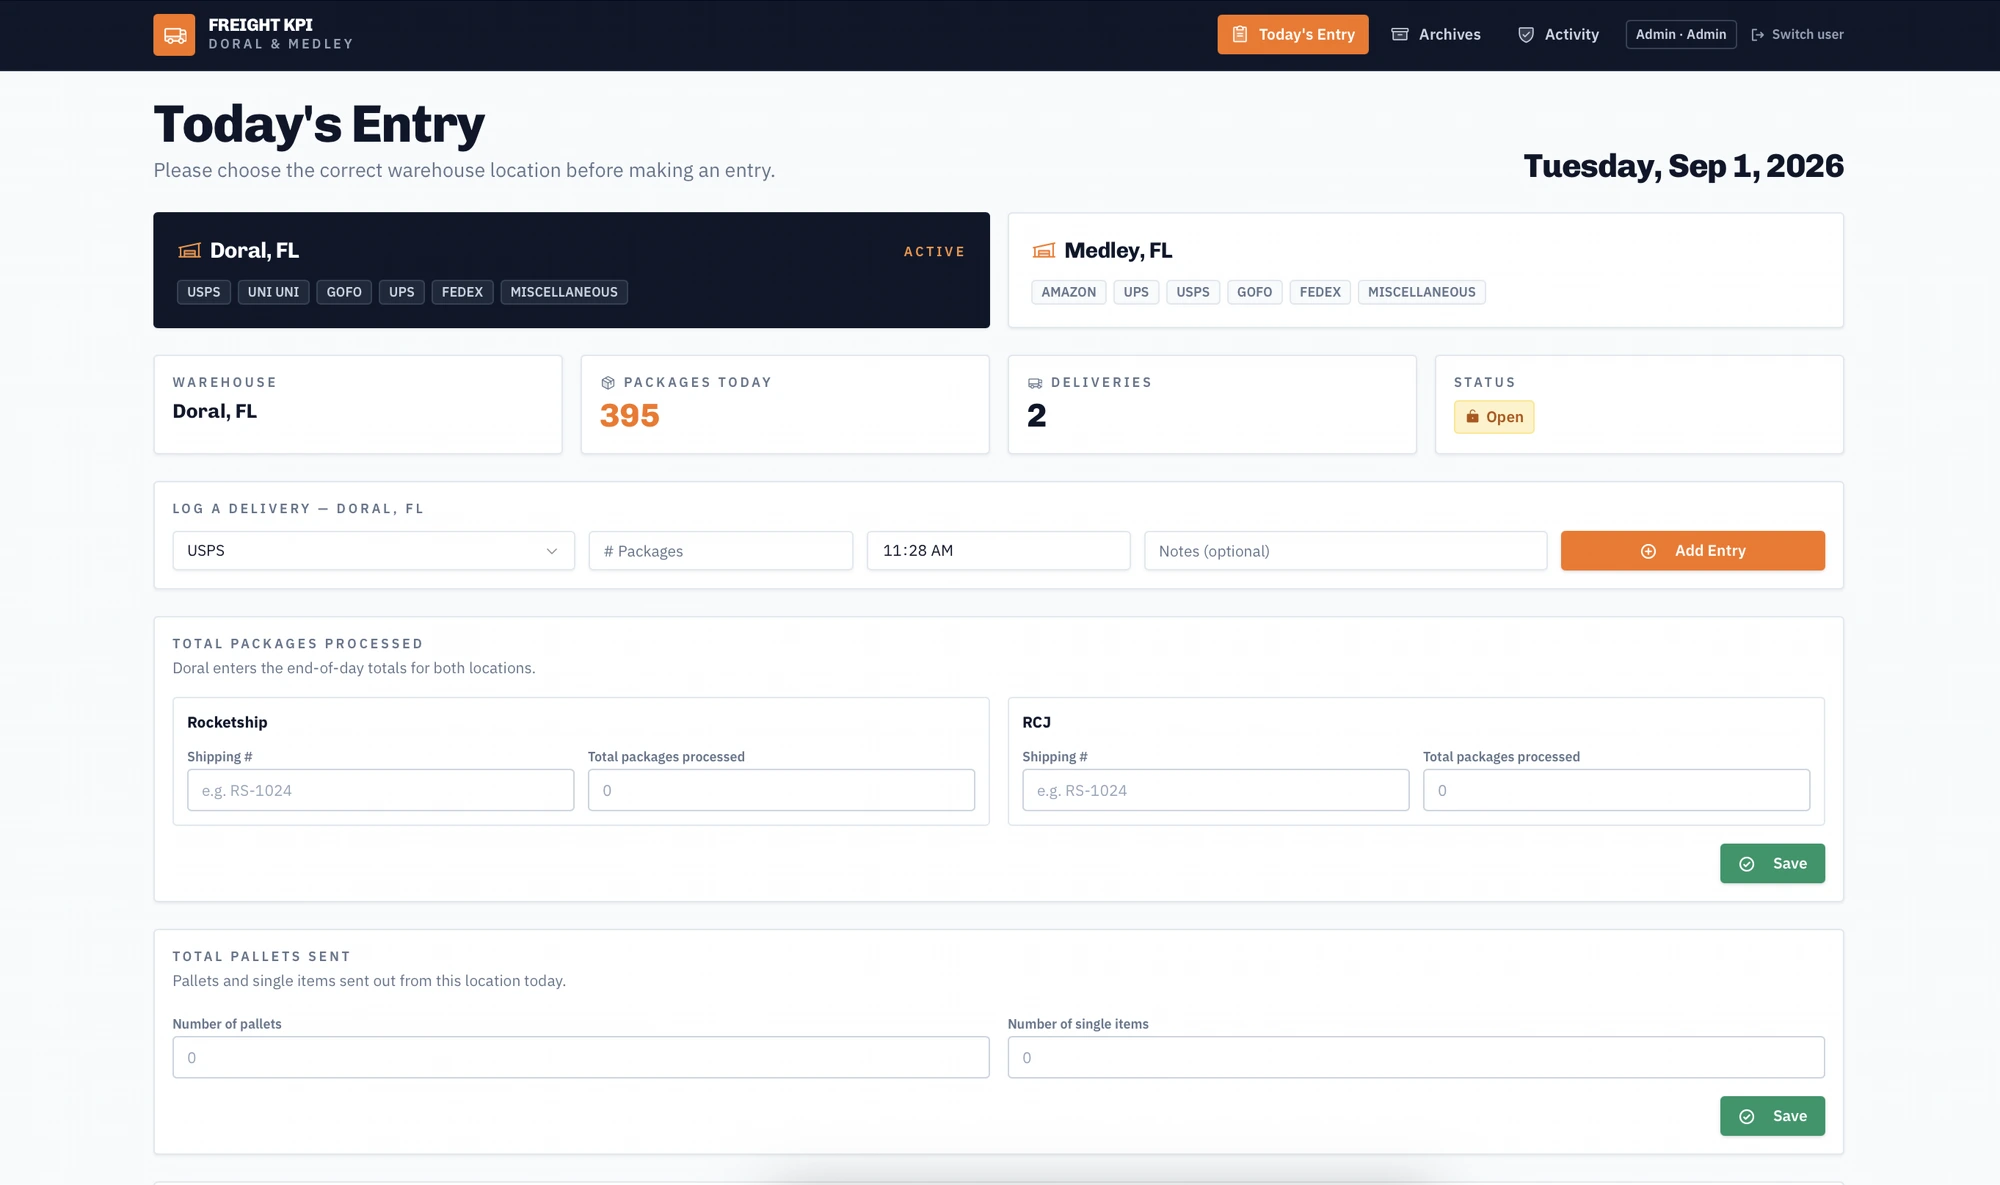
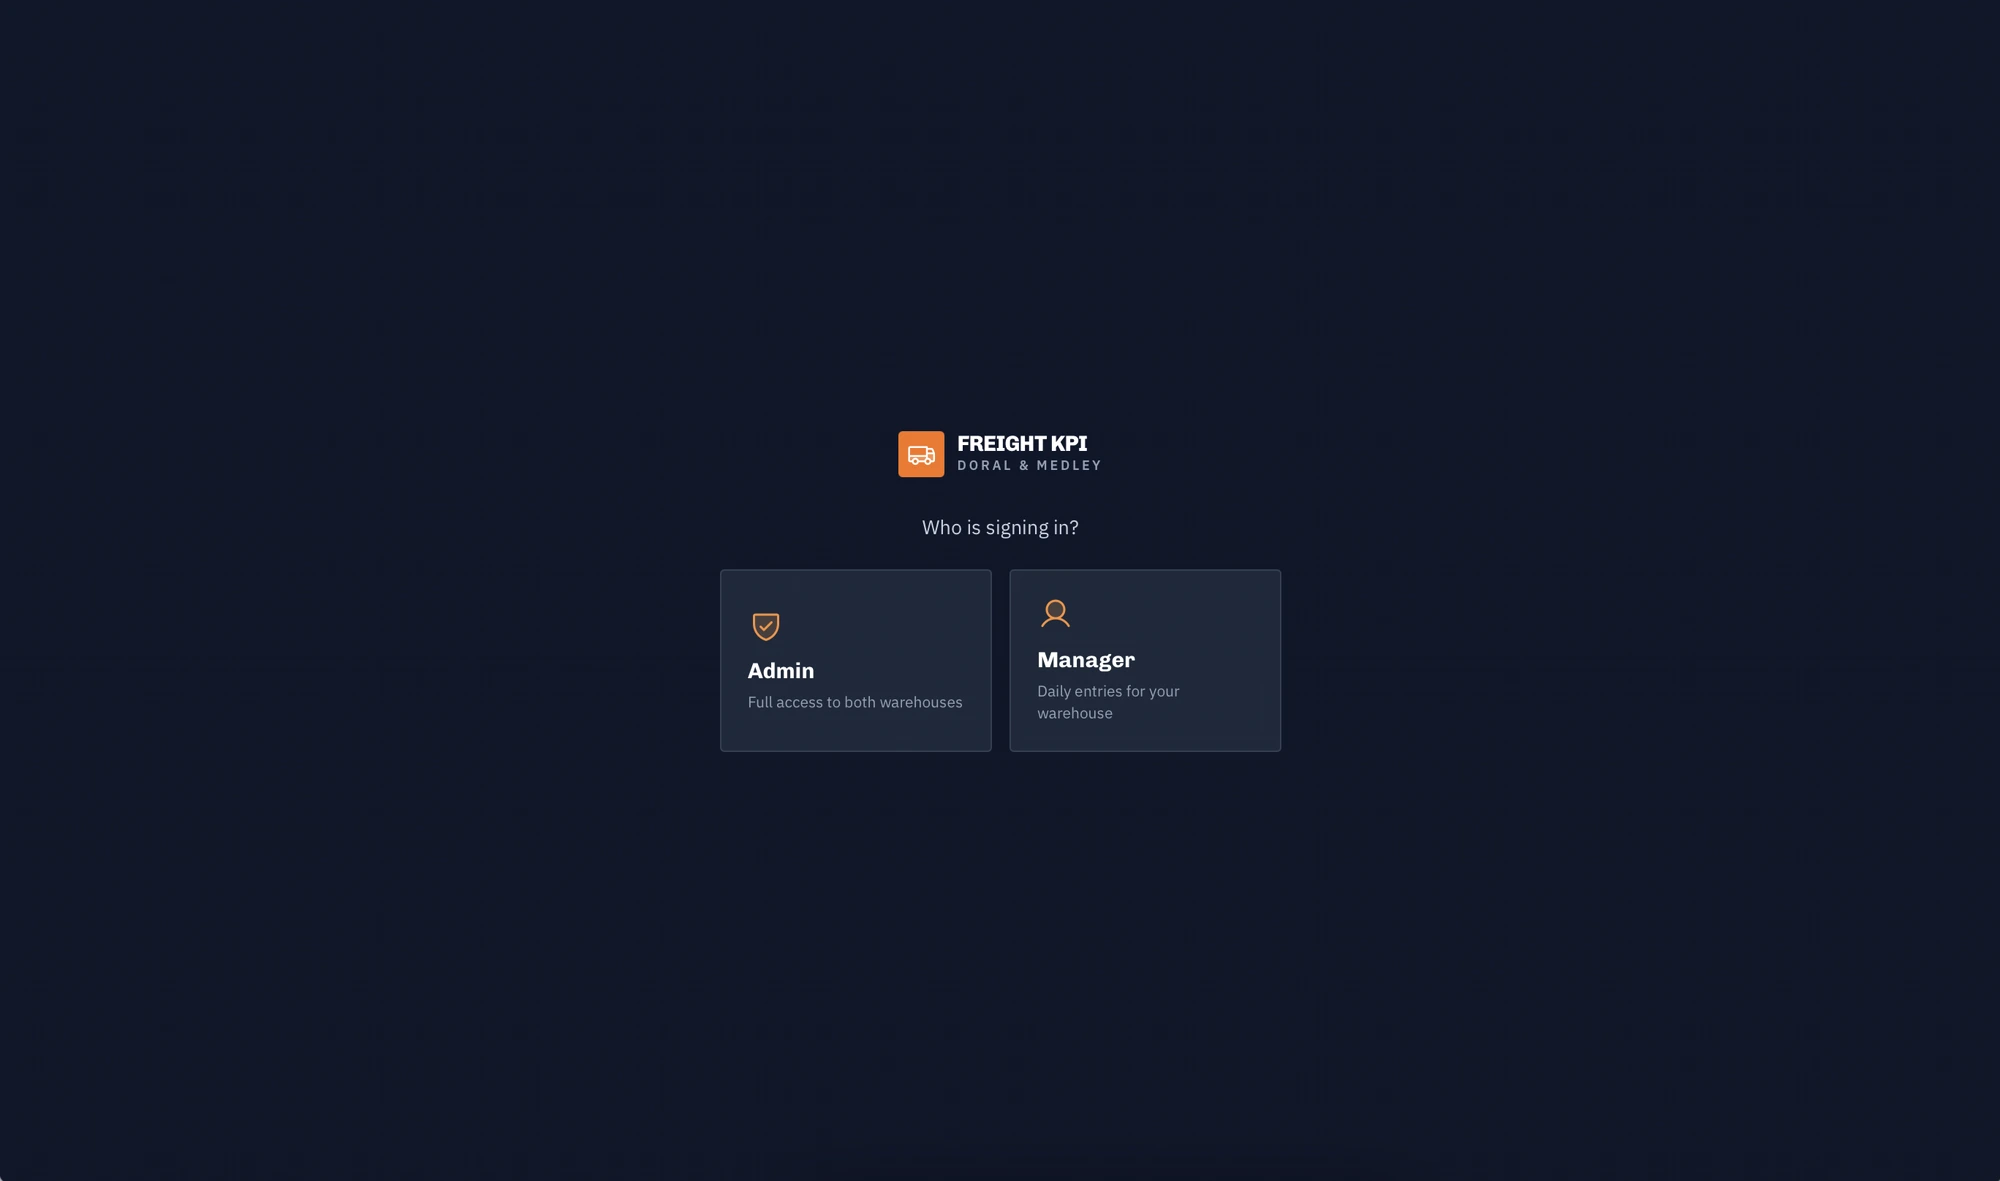
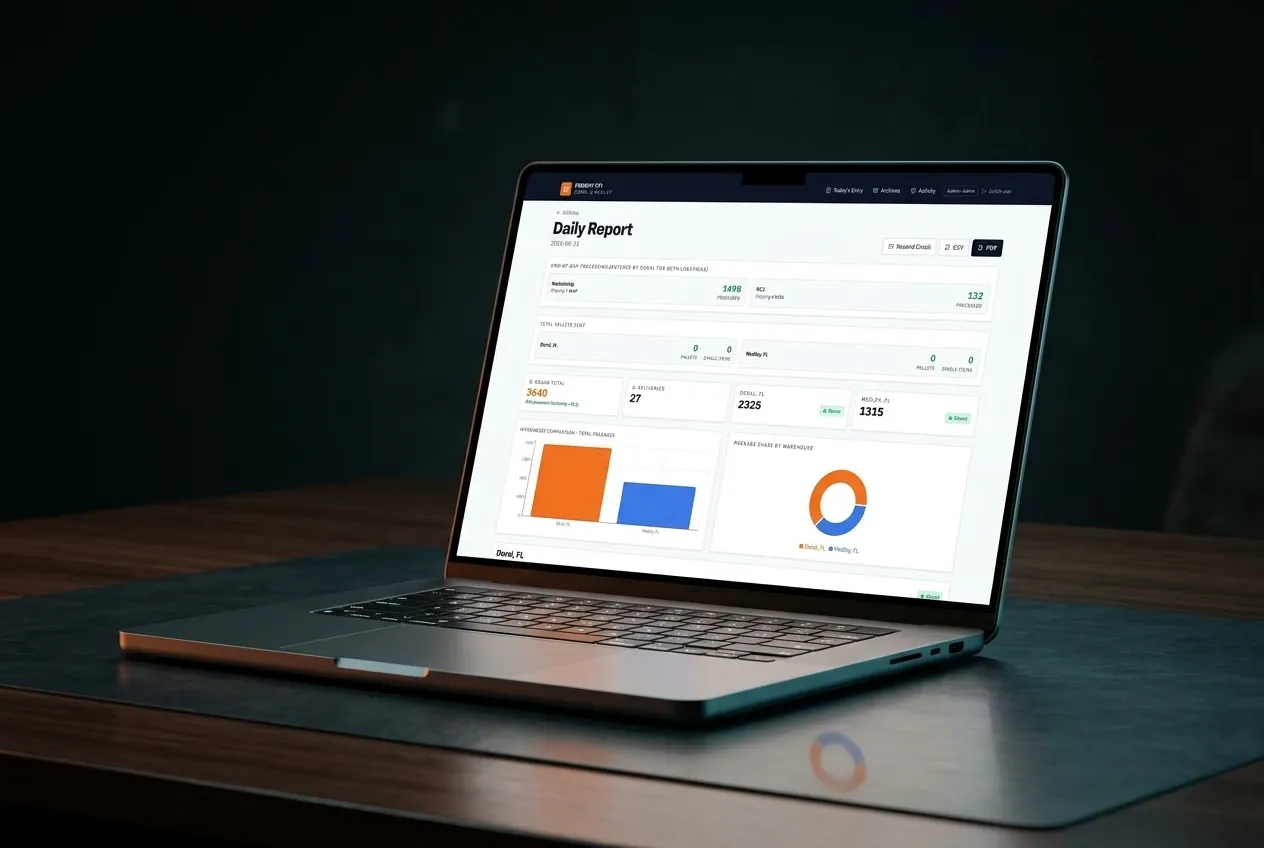
Built an operations dashboard around a simple daily entry flow. Managers log processed, shipped and delivered counts for their own warehouse; administrators see both sites side by side. End-of-day totals roll up into daily, weekly and monthly figures with PDF and CSV export and automated email reports. Role-based visibility keeps each warehouse accountable for its own numbers.
The outcome
The company's first reporting system, now tracking 3.6K+ packages a day across both warehouses. In production, shipped in under three weeks.
// What was built
Key capabilities
- Admin and manager roles with per-warehouse visibility
- Daily entry logging
- Daily, weekly and monthly totals
- PDF and CSV export
- Automated email reports
// Features
Shipped with
- Admin + Manager Roles
- Daily Entry Logging
- PDF / CSV Export
- Email Reports
2 WAREHOUSES / 3.6K+ PACKAGES TRACKED DAILY / IN PRODUCTION
// Screens
Inside the product